Adding Grafana to OctaiPipe Deployment#
When OctaiPipe is deployed to edge devices, the user gets the option of whether to add a deployment of Grafana, either to the edge device or to the cloud (Kubernetes). If no Grafana deployment is necessary, this argument can be left blank, in which case Grafana is not deployed. Grafana is used for the deployment dashboard, which gives the user a visual overview of their edge devices.
There is a default Grafana deployment, set up without the user needing to configure anything except for the location of Grafana (cloud/edge). This deployment is configured to be connected to the output of the deployment, meaning it has access to things like inference, data drift, and other measures saved to the same data location.
There is a default dashboard that shows inference (y_pred of the Model Inference Step), model latency (time to load data, make inference and save results), and overall sensor health (proportion of NaNs across all input features).
This default has three different version depending on the use-case of deployment.
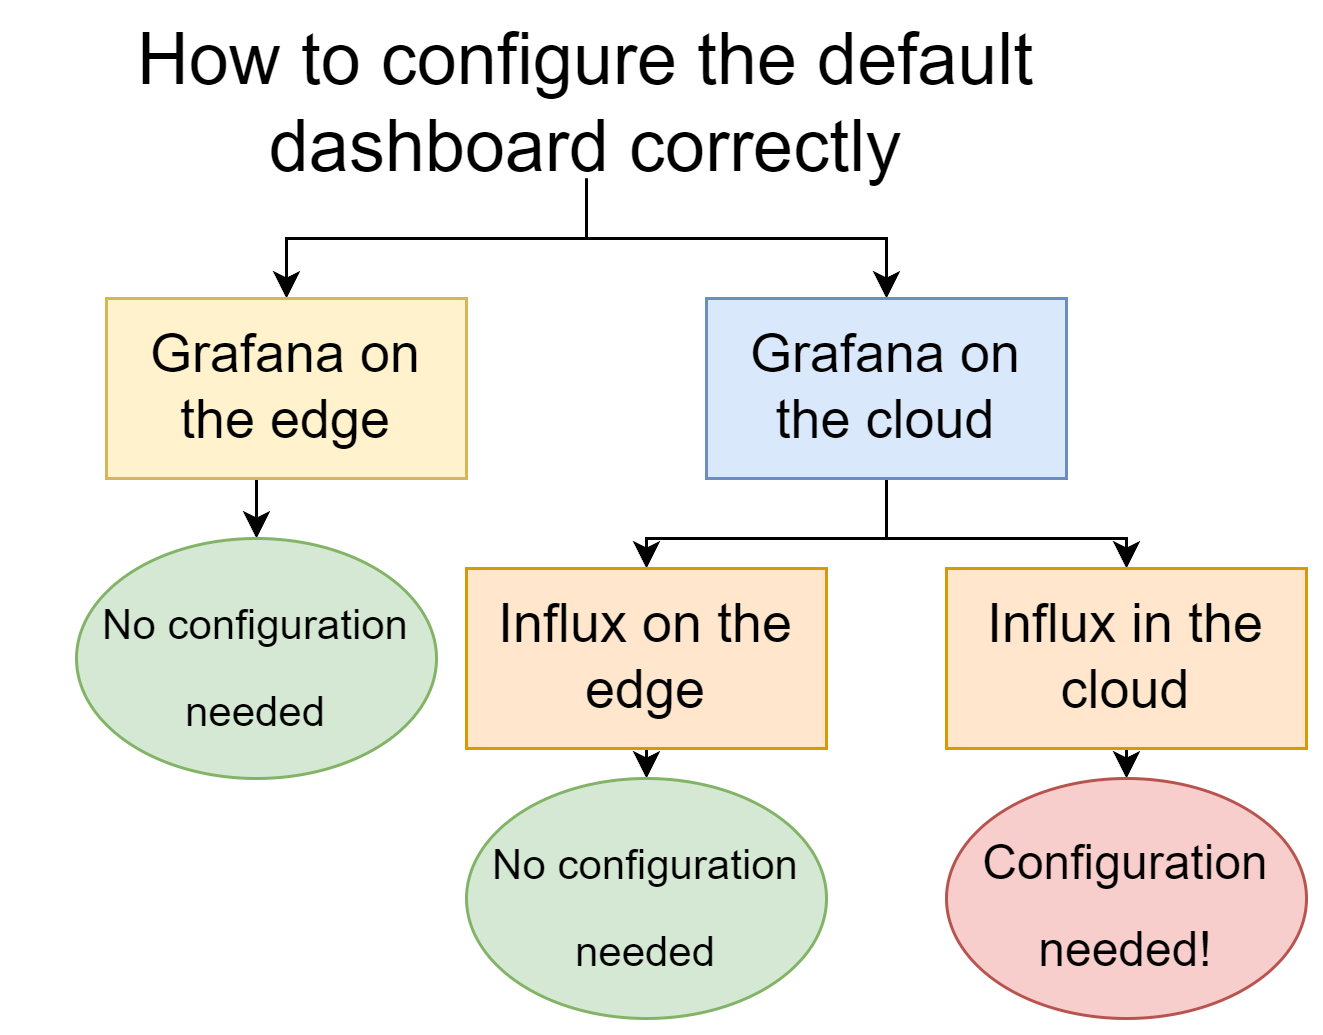
The default template dashboard is only needed to be configured if the user uses
a cloud deployment of Grafana with the edge devices writing to a cloud database.
In such a case, a custom grafana_cloud_specs yaml file needs to be provided by the
user with the data_from argument set to ‘cloud’.
The diagram below shows the decision for how to select the correct dashboard:
For additional model monitoring options or custom dashboards, the user can upload their own dashboards using the OctaiPipe GrafanaClient or create dashboards through the Grafana UI.
The edge deployment of Grafana is relatively simple from a user perspective and is defined in Grafana Deployment to Edge.
To configure the cloud deployment of Grafana, see the Grafana Deployment to Cloud page. Below follows an example of configurations for the cloud deployment of Grafana.
Cloud specs example#
 1deployment_specs:
 2  template_path:
 3  config_dict: {}
 4  output_dir:
 5  namespace: colab
 6
 7dashboard_specs:
 8  grafana_client_info:
 9  template_path:
10  output_path:
11  config_dict:
12  data_from: edge
Deployment specs#
deployment_specs specifies the configurations for the Grafana deployment itself,
meaning how Grafana is deployed to Kubernetes, what data source is added, etc. These
specifications are detailed in Grafana Deployment to Cloud.
Dashboard specs#
dashboard_specs details what dashboard is uploaded to the Grafana deployment
as it is set up. The grafana_client_info is handed to the GrafanaClient to set
up a connection to the Grafana instance. The template_path allows the user to
supply their own dashboard template, uploading a unique dashboard in json format
to the Grafana deployment. The output_path specifies where the configured dashboard
will be saved locally. The config_dict is key-value pairs with the key being a
placeholder in the dashboard template and the value being the replacement.